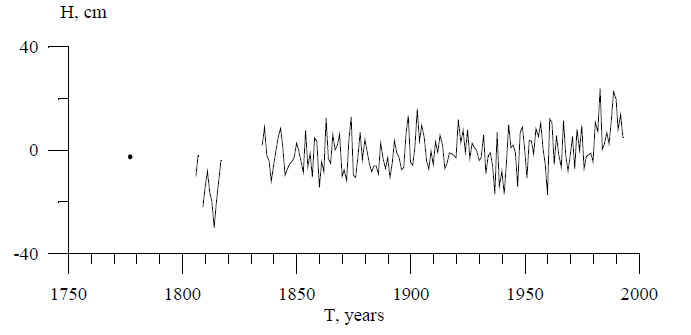
Sea level in the 20th centuryThe facts about sea level rise in the recent past may be relevant, if one is trying to prove or refute that human activities have influenced sea rise. The last part of the Holocene graph above looks constant, on that vertical scale. So are we now experiencing a faster rise in sea level than in the recent centuries? Here we are on tricky ground. The British National Environment Reseach Council runs the Proudman Oceanographic Laboratory. Their web page is a good source of information about land-based sea level measurements. The sources of sea level data are explained here. A typical one is the Kronstadt gauge in Finland. A history of this gauge and its data can be found in a report published by the Finland Geodetic Society. Here's what the data looks like. Each data point is a yearly averages of measurements. There was a catastrophic flood in 1824, and after that, the gauge probably wasn't replaced at exactly the same height as before. Also at other time the gauge may have been disturbed, according to the report.
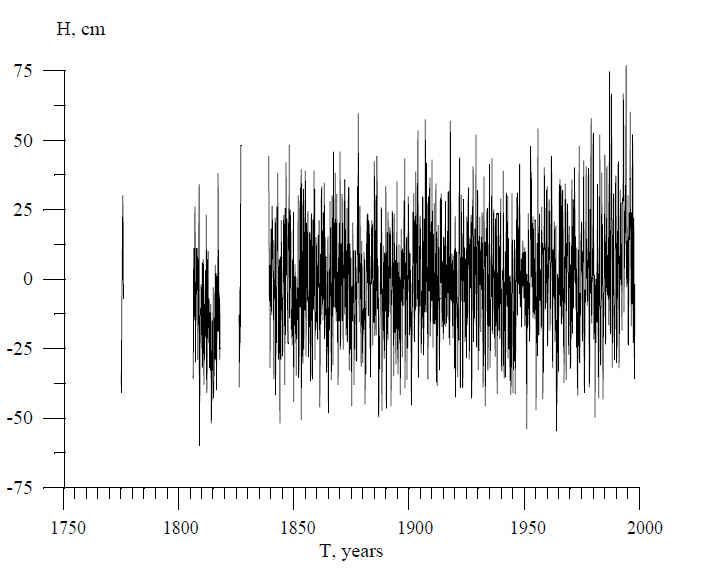
To understand how noisy this data is, look at the monthly (instead of yearly) averages:
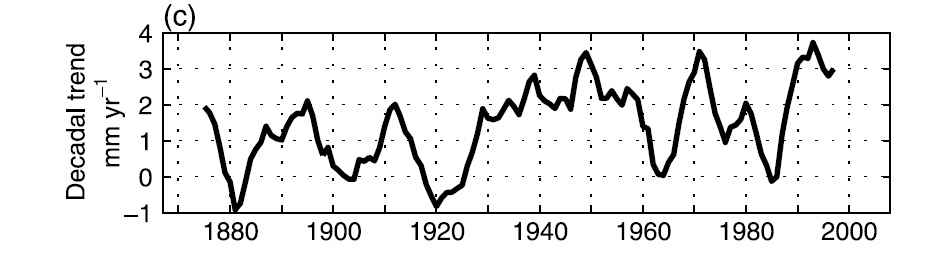
You will note, though, that this data doesn't seem to show sea level rising. Why not? Well, there are reasons, which very well illustrate the difficulties of measuring sea level. I quote from the cited report: Now that you see what the raw data is like, let's consider the peer-reviewed paper An Acceleration in Global Sea Level Rise. This paper uses satellite data (which only began in 1993) to "reconstruct" past sea level rise data. I did not understand how this was done, but here is the result:
The authors then fit a quadratic curve to the sea-level data, which would correspond to fitting this graph by a line. That line would obviously slope upward a bit. They are happy that this confirms a computer model prediction of an "acceleration", while previous measurements had not shown an acceleration. Near the end they say "The quadratic implies that the rate of rise was zero in about 1820 when GMSL [global mean sea level] was about 200 mm below present day values. This level is consistent with estimates from bench marks carved in rock in Tasmania in 1840 [Hunter et al., 2003] and the height of ancient Roman fish tanks[Lambeck et al., 2004], which implies virtually no long-term average change in GMSL from the first century AD to1800 AD." Well, that same quadratic would obviously imply that sea level was decreasing before 1820, which is patently false. If you fit a quadratic to data that goes from 1870 to 1995, you can't expect it to say anything about times before 1870. Both the first and last paragraphs of this paper emphasize the "confirmation" of the computer model. But to say that a graph as wiggly as that one confirms an acceleration requires very fancy statistics, to say the least. We already mentioned an unexplained discrepancy between sea level rise numbers based on terrestrial measurements, and the satellite-based numbers. Note that the numbers in the above graph for the satellite era are the satellite-based numbers (3.1 mm), whereas the earlier numbers must be based on terrestrial measurements, somehow "reconstructed". I suspect that the unexplained discrepancy has crept into that graph. Since this graph is not based directly on measurements, I don't count it as a "fact". Ian Plimer's book, Heaven and Earth, says bluntly (p. 299) "Historical records show no acceleration of sea level rise in the 20th Century." His reference is to a paper in the Journal of Geophysical Research by P. C. Douglas. I haven't read it. Plimer has many pages discussing the difficulties of accurate historical tide-gauge measurements, and says "One has to be extremely optimistic to use tide gauge measurements to determine long-term sea level changes. The chance of long-term consistently accurate measurements is remote. On that same page, Plimer says "Precise satellite measurements give sea level rise has half that measured from tidal stations." But he seems to have this backwards, as he says the corrected tidal station data is 1.8 mm/yr, while we have seen above that 3.1 mm/yr is the satellite number. There is a footnote to an article in Science, which I haven't looked up. |
Michael Beeson's Home Page
-->