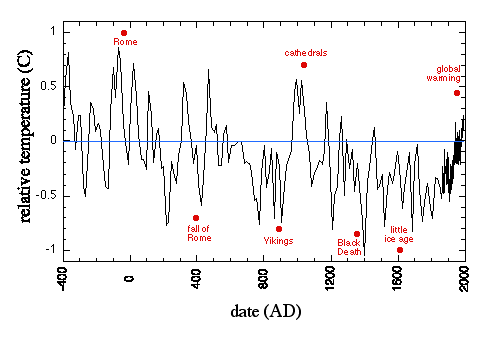
Temperature for the last 11,000 yearsTemperature in the distant past is inferred from "proxies"--a proxy is some measurable quantity that is known to vary in a known way with temperature. One such proxy is the ratio of the two oxygen isotopes 18O and 15O in the atmosphere. Since Arctic and Antarctic ice contains trapped air bubbles, this isotope ratio can be measured for as long ago as ice cores can be recovered. Temperature data has been deduced from the kilometer-long ice core drilled as part of the Greenland Ice Sheet Project GISP2. The zero point of temperature is arbitrarily set to the temperature in 1950. We will show the resulting temperature data in a series of graphs over different time periods. The first graph goes back 2400 years. Observe that for a century around 1000 AD, it was warmer than it is now. This is called the Medieval Warm Period. It was also briefly warmer around 1150 and around 1250. But then it was colder from around 1300 on until around 1900. That cold period is called the Little Ice Age. You might think a half a degree wouldn't make much difference, but it does (as will be discussed on another page, but is hinted at by the remarks in red on the first graph). Right now we are just trying to get the facts straight as to what the temperature actually was at different times and places.
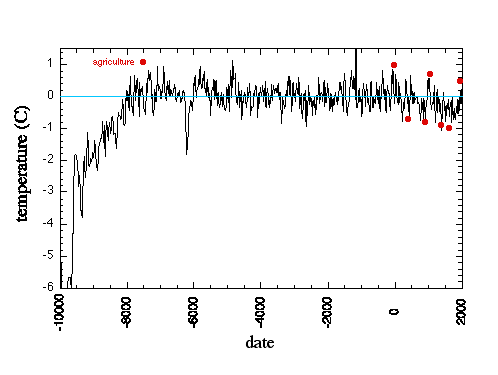
It's interesting how the temperature is related to the isotope ratio of oxygen, but we won't discuss that here, because it doesn't seem to be at all controversial. The second graph goes back 11,000 years, to the end of the last Ice Age, or glaciation:
You can still see the Medieval Warm Period and the Little Ice Age at the right of the graph, but you can also see that they were nothing very unusual, as there were other warm and cold periods in the preceding millennia. But those variations (all but one less than one degree) are nothing compared to the warming immediately after the end of the glaciation. Maybe the time when humans "discovered" agriculture wasn't so accidental. The commentary on this graph by Muller et. al. is worth repeating:
|
Michael Beeson's Home Page
-->